Quick take:
- ChainLink (LINK) has hit a new all-time high value of $6.85.
- The high network activity of LINK is one reason the token keeps gaining in the crypto markets.
- An earlier prediction had put LINK at $8 by December 2020.
ChainLink (LINK) has hit a new milestone today in the form of an all-time high value. At the time of writing this, LINK broke the $6.57 resistance zone to claim the new all-time high value of $6.85 – Binance rate.
High Network Activity Keeps Pushing LINK Higher
The success of LINK comes as no surprise as the activity on the ChainLink network has continued to grow since the beginning of 2020. The daily active addresses on the LINK network hit a new high of 9,335 on the 8th of July. The team at Santiment captured this achievement via the following tweet.
$LINK is continuing to see sky-high daily active addresses, indicating just how active the network has been. The four highest outputs in network activity over the past year for #Chainlink have occurred in the past six days. https://t.co/9Vn1WSNKjX pic.twitter.com/1xVMVgfWAV
— Santiment (@santimentfeed) July 10, 2020
LINK Network Activity Provides Future Price Insights
The last time the activity on LINK was this high, was in June 2019 around the same time LINK hit an earlier all-time high of $4.80. Therefore, it can be concluded that network activity on the LINK network can be used to anticipate price movement as explained by Timothy Peterson and the team at Cane Island.
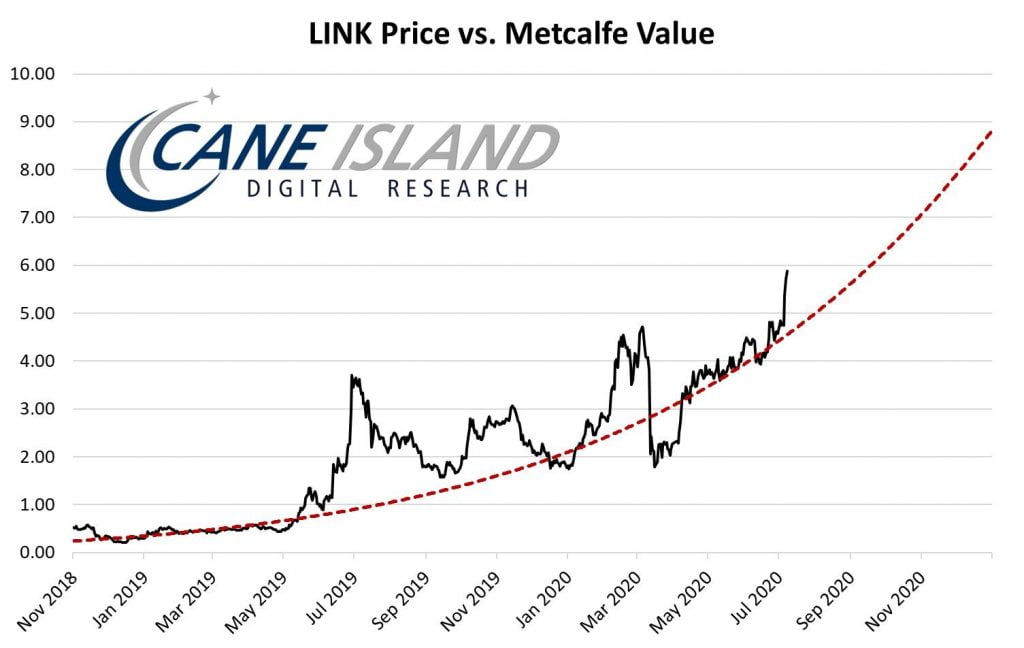
In a recent analysis of ChainLink, the team at Cane Island explained that LINK users grew by 17% per month and the future adoption of the ChainLink network would drive adoption of the token as well as its price. The analysis of LINK by the team at Cane Island also provided the following chart that predicts an $8 LINK by December 2020.
Brief Technical Analysis of ChainLink (LINK)
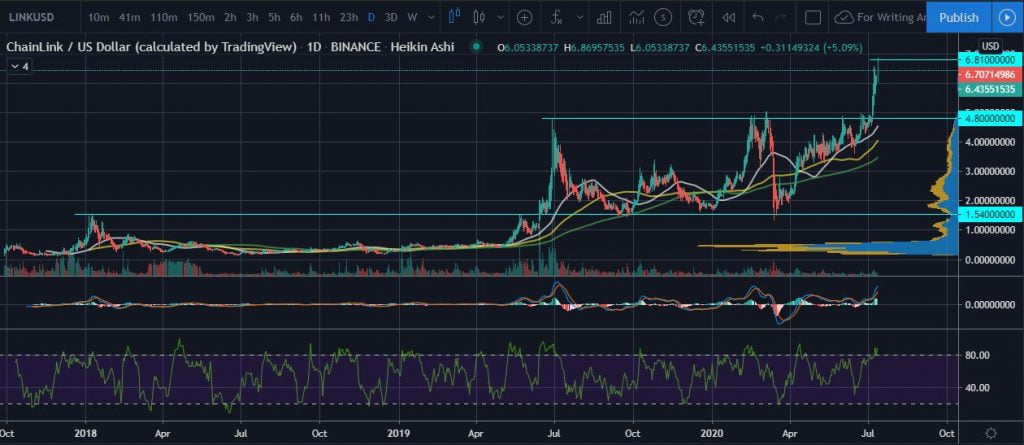
To provide a clearer picture of the price movement of LINK since September 2017, we can zoom out a bit on the daily LINK/USDT chart courtesy of Tradingview. The chart (below) clearly illustrates how past LINK resistance levels have flipped to become major support levels on a macro view.
Taking a historical look at the daily LINK/USD chart, the following can be concluded.
- The January 2018 all-time high of $1.54 eventually turned into solid support as seen in September 2019 and during the Coronavirus crash of mid-March, 2020.
- The July 2019 all-time high of $4.80 has been a serious resistance zone attempted before the crash of mid-March and could end up becoming the new support zone on a macro scale.
- Trade volume is still in the green and the daily MACD is yet to show sights of exhaustion further pointing to LINK possibly breaking its new all-time high of $6.85.
- MFI points to an overbought situation. Therefore, going long on LINK should be done with caution.
As with all analyses of ChainLink (LINK), stop losses and the use of low leverages is advised. Additionally, keeping an eye out for Bitcoin’s price movement will provide a measure of the fate of the crypto markets.


