Earlier this month, Bitcoin (BTC) plunged for the umpteenth time in months, plunging as bulls failed to step in. At the drop’s worse, the leading cryptocurrency was changing hands for $6,400, marking a multi-month low.
At the time, analysts were scared, so scared that they expected the price of BTC to collapse to $5,000s. Though, at the 11th hour, bulls made their presence known, commencing a recovery rally that brought Bitcoin as high as $7,700 just this morning.
As of the time of writing this, BTC is trading for $7,400, meaning that the asset is up 15% since the local bottom. Sure, this is undoubtedly a bullish reversal, though a top analyst has asserted that the macro bear trend that pulled Bitcoin from $14,000 to $7,000 in a few months’ time remains intact. Here’s why.
Bitcoin Macro Downtrend Intact?
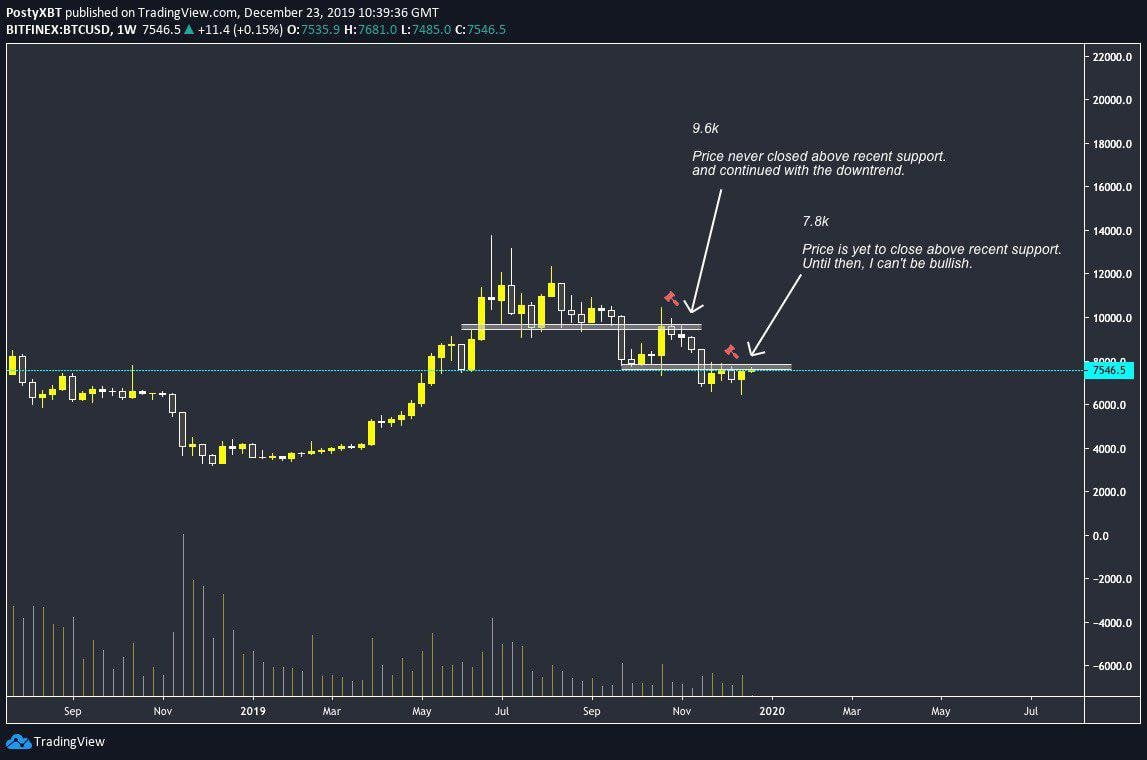
PostyXBT, a popular trader and crypto entrepreneur, recently remarked that while he believes Bitcoin’s recent price action is extremely bullish for BTC on a shorter-term scale, the long-term downtrend remains intact for one reason: BTC continues to trade under the key $7,800 level. He elaborated in a message posted to his Telegram channel:
However, the macro set up remains the same. Until we see a weekly close above 7.8k or further momentum from bulls, my set up remains valid.It’s easy to be distracted with all the noise from CT as the bulls are out in force and I understand why.
$7,800, as marked by his chart (seen below), has acted as both a key support and a key resistance level for BTC over the past few months, meaning that reclamation of the horizontal on a weekly basis would be a boon for bulls.
Bulls Beg to Differ
Some beg to differ.
According to prominent cryptocurrency chartist Dave the Wave, Bitcoin’s one-week Moving Average Convergence Divergence (MACD) — the MACD is a lagging trend indicator used by many technical analysts — is likely going to see a crossover early next year after trending lower for the next two months. Dave wrote:
“Weekly MACD shaping up to re-cross bullishly soon to confirm the continuation of the next cycle,” the popular trader wrote.
Bullish MACD readings on Bitcoin’s one-week chart marked the start of previous bull runs, including the miniaturized one seen from March of this year to July.
Featured Image from Unsplash


