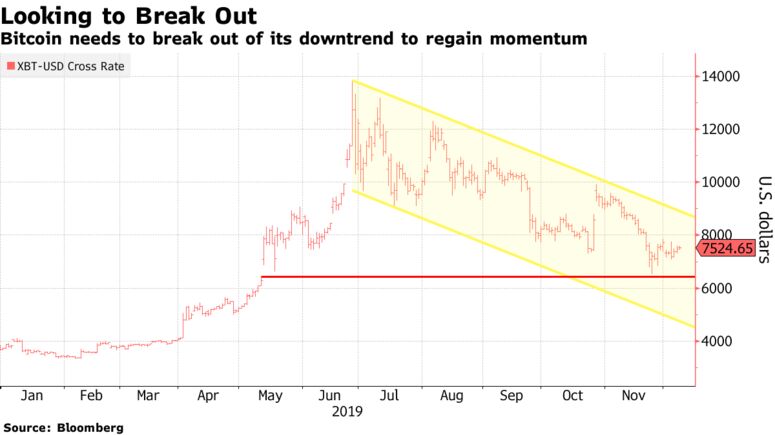
Over the past few days, the price of Bitcoin (BTC) has finally started to stabilize, finding itself trading between $7,000 and $7,800 as the cryptocurrency market aims to establish some near-term directionality.
While this consolidation has really been neither bullish or bearish due to its brevity on a macro scale, Bloomberg has suggested that it may be a sign of a bottom.
Has Bitcoin Bottomed?
In an article titled “Bitcoin in Wait-and-See Mode as Downward Trend Persists,” Bloomberg wrote that with Bitcoin’s price stabilizing “above its support level of the initial [CME futures] gap created on May 10,” there’s potential that a bottom was marked in the $6,500 range, which the cryptocurrency breached late last month shortly after tumbling under $8,000 after hitting $10,500 in the now-infamous “China pump.”

Bloomberg did note though that the cryptocurrency remains in a bearish descending channel pattern it formed in late June when it reached the year-to-date high near $14,000. “BTC would need to break out of this downtrend in order to regain positive momentum,” Bloomberg wrote, accentuating the importance of the cryptocurrency breaking above the channel.
Though, Mike McGlone, an analyst at the firm, was cited as saying that it is “only a matter of time” before the cryptocurrency breaches through resistance, the most notable of which being the horizontal and psychological resistance at $10,000.
McGlone backed this optimistic quip by looking to a potential rally in gold, which he claims would boost the Bitcoin bull narrative, as such a rally would be caused by macroeconomic turmoil, something analysts say is beneficial for alternative assets as a whole. He also looked to growing levels of adoption in the cryptocurrency space coupled with the idea that the impending halving will act as a negative supply shock for Bitcoin’s market economics.
Other Analysts Agree
Other analysts agree with this positive sentiment.
Per previous reports from Ethereum World News, top trader Cantering Clark recently observed an “uncanny resemblance” between the BTC price action seen over the last few days and the aforementioned accumulation phase. Indeed, as Clark’s two charts seen below show, the Bitcoin price action seen then and now are very similar directionality-wise, with there being drops now where there were drops in late-2018 and such.
“It would make sense that after the first major move up, that the first major correction and following accumulation period would have a fractal resemblance to the larger original,” Clark elaborated, pointing out the intricacies of the potential fractal poised to play out in real-time.
There is an uncanny resemblance between these two charts.
It would make sense that after the first major move up, that the first major correction and following accumulation period would have a fractal resemblance to the larger original.
The purpose is still the same.$BTC pic.twitter.com/eRQA9PRJSZ
— Ryan 🐎 Cantering Clark (@CanteringClark) December 9, 2019
Jonny Moe, another popular analyst, also recently observed that the chart of the leading cryptocurrency has printed a bullish Adam & Eve bottoming and reversal pattern, which was seen in late-2018 and early-2019 when the cryptocurrency was trading in the $3,000s.
Featured Image from Unsplash

