In brief:
- Ethereum is once again battling to maintain the $228 support zone.
- All signs point to BTC heading to lower levels.
- However, ETH’s bullish momentum is very much intact primarily due to ETH2.0.
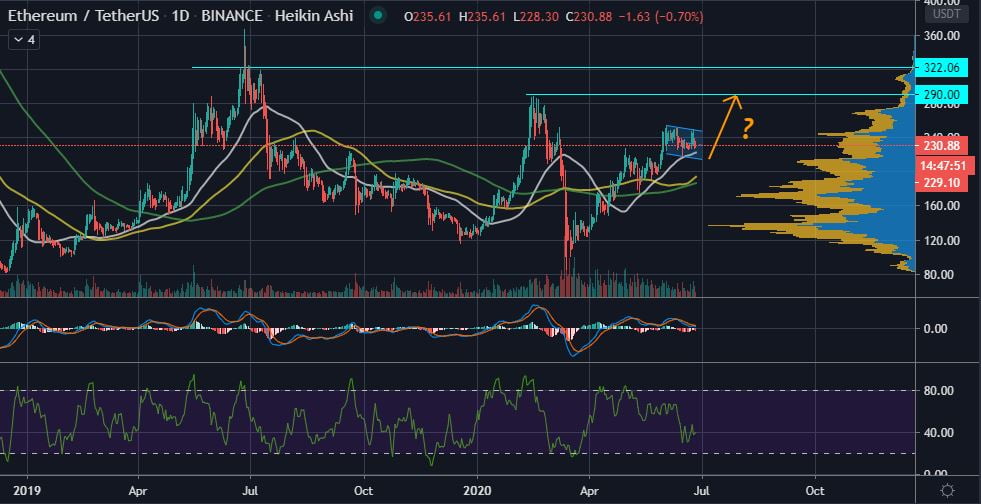
- Ethereum could be printing a bull flag on the daily chart that could ultimately push its value to $290 levels.
It is the last Friday of June 2020 and the crypto markets are very much volatile with Bitcoin trading at $9,100 and Ethereum battling to maintain the now common $228 support zone. Earlier today, both BTC and ETH were trading at approximately $9,340 and $235 respectively. However, with the CME Bitcoin futures expiring today, June 26th, it was somewhat expected that it would be a red day in the crypto markets.
Ethereum Could be Printing a Bull Flag on the Daily Chart
As earlier mentioned, Ethereum is once again fighting to maintain the $228 support zone that has continued to provide a very strong support area for ETH in the month of June. Additionally, and after taking another look at the daily ETH/USDT, there seems to be a bull flag forming that could ultimately lead to Ethereum bulldozing through the $250 resistance zone with the new month of July and ultimately testing the next major resistance zone of $290.

Taking another look at the daily ETH/USDT chart courtesy of Tradingview.com, the following can be observed.
- Trade volume is in the red with the MACD also indicating increased selling activity.
- MFI is stable at neutral territory around 40.
- The 50-day moving average is providing adequate support around $222.
- The 100-day and 200-day moving averages also provide support on a macro level at around $195 and $186 respectively.
- The lower boundary of the descending parallel channel also provides some support at $214
Conclusion
The month of June is coming to a close and the CME Bitcoin futures expire today, June 26th. Consequently, the crypto markets, led by Bitcoin and Ethereum, are experiencing the usual selling as the contracts come to a close.
However, in the case of Ethereum, the daily ETH chart could be printing a bull flag that would allow the coin to break the $250 resistance zone and possibly test $290 in the first half of July. This is hinged primarily on the fact that there is a bullish Ethereum event in the form of ETH2.0. Additionally, Bitcoin’s dominance in the crypto markets has continued to drop as explained by the team at Pantera Capital in an earlier report.
All these factors could align to provide the necessary bullish momentum necessary for Ethereum to continue on its upward trajectory.
As with all analyses of Ethereum, traders and investors are advised to use risk management techniques such as stop losses as well as keeping an eye out for any sudden Bitcoin movements that could affect the entire crypto markets.

