Bitcoin Price to Fall Due to Triangle?
Over the past few weeks, traders have come to the realization that Bitcoin (BTC) is trading in a clear “descending triangle” pattern. For those unaware, a descending triangle is a bearish chart pattern that is marked by lower highs and multiple bottoms at the same level, coupled with ever-decreasing volumes into the apex of the triangle.
Traders have come to see these triangles as bearish, as they often result in the asset in question falling through the bottom after a certain number of bounces to establish a new trading range.
Indeed, Bitcoin was actually in a descending triangle during mid-2018, which led to the collapse from $6,000 to $3,000, and was in an ascending triangle (the exact opposite of the aforementioned pattern) during the bottoming process in December 2018 and Q1 2019.
What’s even more harrowing is that analysts have claimed that due to the aforementioned descending triangle, Bitcoin is currently looking as it did during 2018’s bear market, implying a strong move lower in the coming weeks.
But, some have tackled this chart pattern with an optimistic point of view. Analyst B. Biddles, who famously called Bitcoin’s rally to $14,000 (not price, but the speed and the trend), recently pointed out that in June and July of 2017, Bitcoin broke below a descending triangle, then skyrocketed higher.
While he asserted that it would be foolish to assume that the same can occur, Biddles added that it is a sign that anything could happen, including Bitcoin above a large descending triangle pattern.
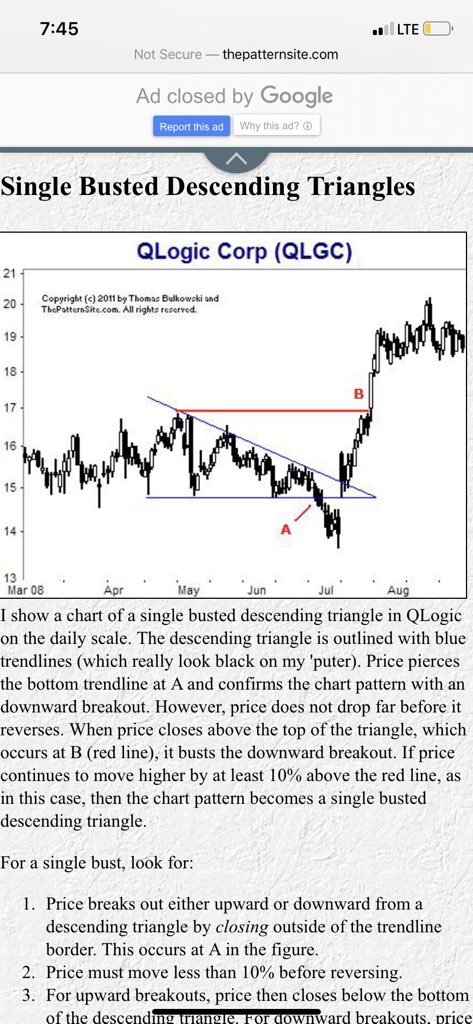
Murad Mahmudov, the co-founder of Adaptive Capital, echoed this thought, posting the photo below that shows that a technical analysis site recognizes a trend called “single busted descending triangle”, which is what Biddles pointed out in the above Bitcoin chart.

Peter Brandt, a prominent commodities trader, has acknowledged the potential for an upside breakout, too. As reported by this outlet previously, he said that there have been “numerous occasions over the years” (he’s presumably citing his experience as a trader) where assets broke out above the triangle, not below it.
But at the end of the day, it is widely acknowledged that descending triangles more often than not resolve downwards rather than upwards. In the end, technical analysis is a game of probabilities, not certainties.
So, to answer the question posed in the headline, the descending triangle that Bitcoin is currently situated in doesn’t have to be 100% bearish.
In fact, depending on the macro backdrop and other technical factors, a descending triangle may have a high probability of breaking higher. Right now, this may be the case. Bakkt is poised to launch its Bitcoin futures contract; massive firms have expressed interest in cryptocurrencies and blockchain; and the world has started to enter a seeming recession, which is likely to only increase the demand for alternative assets.
Photo by Kenrick Mills on Unsplash

