Summary:
- Dogecoin has been consolidating between $0.041 and $0.064 since mid-February
- The 50-day moving average provides a possible area for a bounce at the lower boundary of $0.041
- Dogecoin’s correlation to Bitcoin has dropped since October 2020
- Dogecoin’s fate is tied to Elon Musk’s tweets and the various online crypto communities
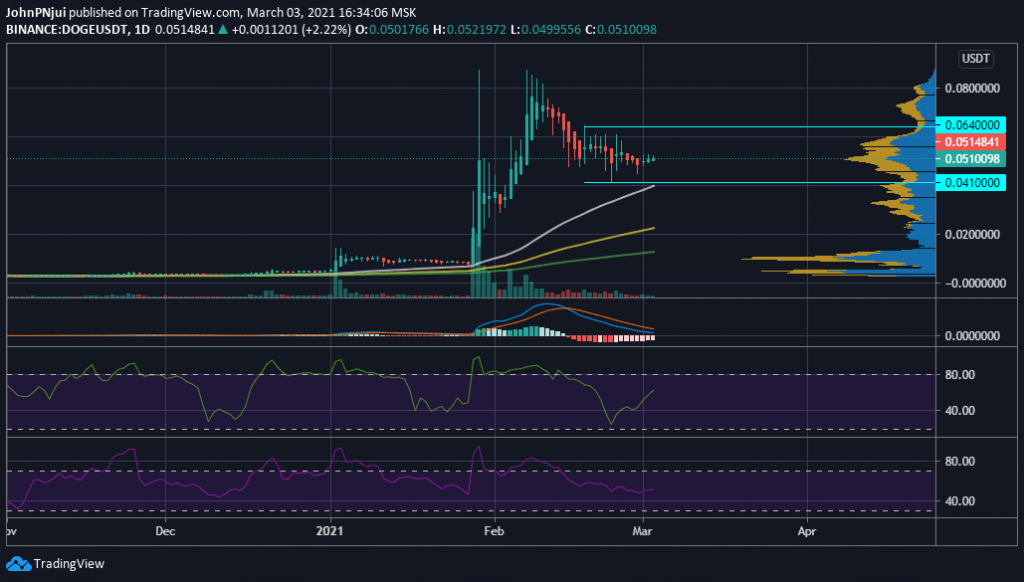
The popular meme-coin of Dogecoin (DOGE) has been consolidating for the second half of February between the values of $0.041 and $0.064. This is after DOGE set a new all-time high of $0.088 on the 29th of January and would once again retest this price area on the 8th of February.
Dogecoin’s 50-Day MA is the Support to Watch in March
Dogecoin’s consolidation between the aforementioned price areas can be seen in the following DOGE/USDT daily chart. At the time of writing, Dogecoin is trading at $0.051 with the 50-day moving average providing adequate short-term support for DOGE into the new month of March.
Also from the chart, the following can be observed.
- Selling pressure seems to have reduced with the new month
- Daily trade volume is a bit on the lower side
- The daily MACD is attempting to cross above the baseline in a bullish manner
- The daily MFI and RSI are in neutral territory of 61 and 51 respectively
- The 50-day moving average (white) provides adequate support for Dogecoin around the $0.041 price area
- The 100-day and 200-day moving averages provide macro support areas at $$0.022 and $0.0127 respectively
Summing up the brief technical analysis, Dogecoin might continue to consolidate in the earlier identified zone of between $0.041 and $0.064 for a few more days before a concrete direction is seen. One scenario is a drop to the 50-day moving average based on the decreasing daily trade volume identified above.
DOGE’s Correlation With Bitcoin Continues to Drop
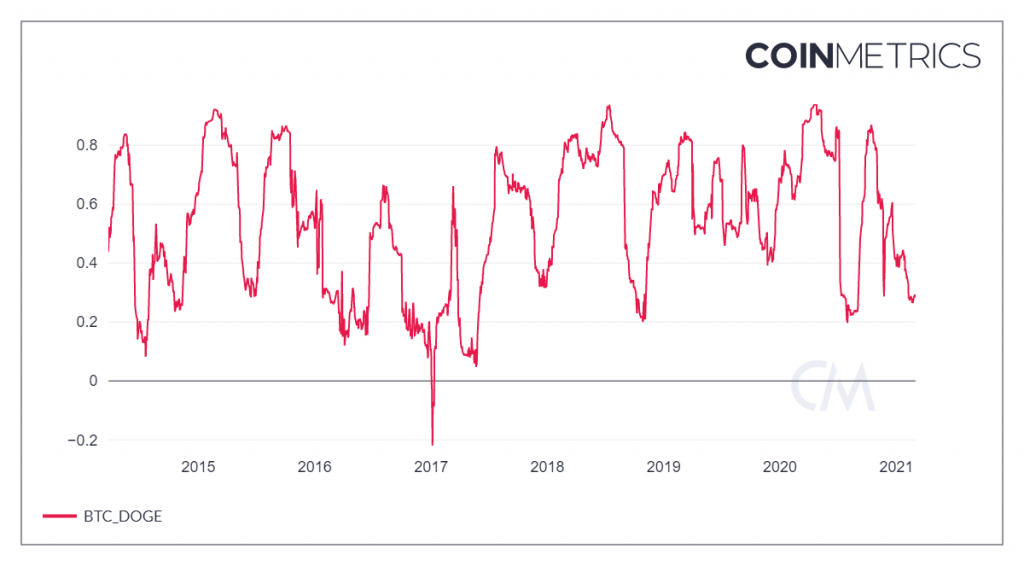
To note is that Dogecoin has more or less broken loose from the effects of Bitcoin since late last year. This fact is best exemplified by the following Dogecoin/Bitcoin correlation chart provided by Coinmetrics. From the chart, it can be observed that Dogecoin’s correlation has been dropping since October 2020 levels of 0.86, to the current low levels of 0.285.
 The drop in correlation between Dogecoin and Bitcoin could be due to the unofficial CEO of DOGE, Elon Musk, constantly tweeting about the meme-coin. This fact, coupled with the popularity of Dogecoin through the WallStreetBets community, has allowed DOGE to break free from the direct effects of BTC’s price action. This also explains Dogecoin’s minimal response to Bitcoin reclaiming $50k earlier today.


