If you’ve followed the Bitcoin, Ethereum, XRP, and broader crypto technical analysis circles, you likely know of the TD Sequential.
The indicator, created by Point 72 consultant and well-known investor Tom DeMark (hence TD Sequential), has long been a staple of the trading suites of many investors, giving these traders a way through which they can determine where assets have found local tops and bottoms.
It has done extremely well in determining Bitcoin price action. Demark told Bloomberg in a recent interview that his indicator has been extremely accurate in marking crypto market inflection points on a macro basis: he revealed that a 13 candle, which signifies a strong trend reversal, was registered by the TD Sequential when Bitcoin hit $20,000 in December 2017, and that another 13 candle, was seen when BTC cratered to $3,150 on December 14th. What’s more, a 13 candle was printed at the $14,000 top seen in June of this year.
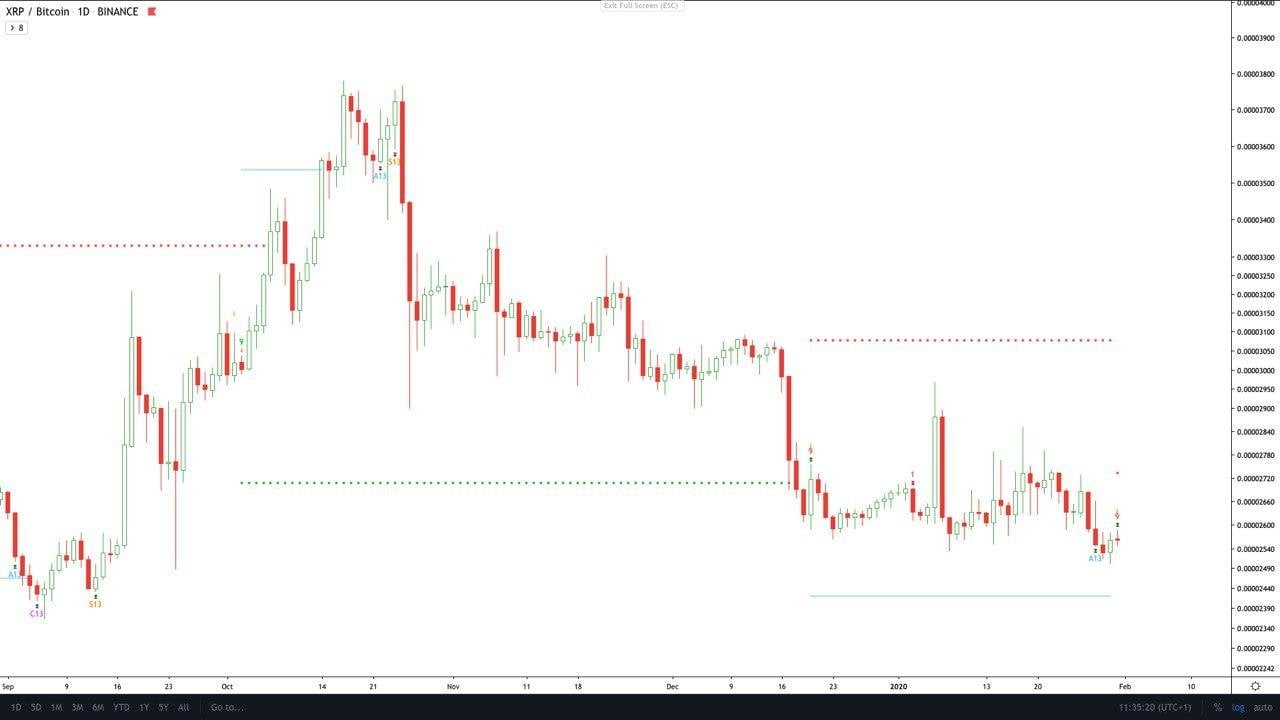
While it isn’t clear how accurate this indicator is for XRP, the TD Sequential just flashed a buy signal for the altcoin’s chart against Bitcoin (XRP/BTC), potentially signaling that the pair is on the verge of moving higher.
TD Sequential Flashes XRP Buy Signal
According to a Telegram channel tracking TD Sequential indicator signals on a number of assets, cryptocurrencies and commodities especially, the XRP/BTC one-day chart saw a “Buy 9” (notably different than the Buy 13 candles seen with BTC, but bullish nonetheless) candle during Friday’s trading session. Should the indicator play out as it does in textbooks, XRP could soon begin to rally against Bitcoin.
That’s not all signaling for this trading pair to continue higher after bottoming in January.
Per previous reports from this very outlet, analyst Bitcoin Jack noted that the XRP/BTC trading pair has a bullish setup forming, recently forming somewhat of a bottom at key levels. He claims that the cryptocurrency could soon surge from 2,536 satoshis to 2,879 satoshis — a gain of 13.5% over the coming weeks.
On a longer-term basis, TraderXO noted that XRP against BTC has been trading in a manner similar to a chart pattern or schematic described by legendary chartist Richard Wyckoff. The schematic is the Wyckoff Accumulation pattern, and it implies that XRP is currently in Phase C of accumulation, which correlates with a strong surge in prices back to the range high.
Should the Wyckoff schematic play out in full, the price of the altcoin will surge towards 5,000 satoshis, and maybe beyond.
Photo by Sven Piek on Unsplash


